In 2023, I began a program of research on some innovative governance arrangements for addressing homelessness that LA’s political, civic, bureaucratic and private sector leaders put in place as part of a determined effort to finally come to grips with a long-festering crisis (see here and here). Over the past two years, the tide of Los Angeles’ homelessness seemed to turn. However, as highlighted by some extraordinarily forthright and stark presentations (available here) at a recent meeting of one of the new bodies – the multistakeholder Leadership Table for Regional Homeless Alignment – new budgetary and economic pressures threaten reversal.
In coming months I plan to track how the governance arrangements respond to this new trial by fire. This piece (and an accompanying technical note) sets the stage for that work by laying out – from an empirical and ‘technocratic’ rather than a governance perspective – how I have come to understand LA’s homelessness crisis. The analysis builds on some recent innovative applications of systems analysis (here and here) that frame homelessness as a “flow”, rather than only as a “stock”. As the systems approach suggests, framing homelessness as a flow both helps surface some perhaps under-recognized aspects of LA’s homelessness challenge, and directs attention to some potentially important questions vis-à-vis the policy response to the new, straitened circumstances.
Figure 1: Homelessness in LA – inflows and outflows (2023)
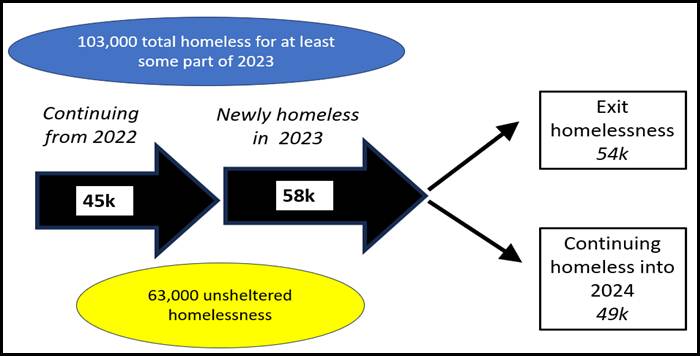
Source: Leadership Table
At first sight, Los Angeles’ challenge seems straightforward: end homelessness for the 70,000 or so people -roughly 50,000 of whom live on the streets – identified as homeless in recent iterations of the region’s annual point-in-time (PIT) count. However, as Figure 1 illustrates for 2023, the PIT count (a “stock”) captures only a moment in an ongoing and much larger flow: in that year 103,000 people accessed LA County’s homeless services. [Note that, while the analysis that follows draws principally on data from 2022/23, newly released data reports a 30% (!!!) increase to 133,000 in the number accessing these services in 2024/25.] Between 2020 and 2024, close to 300,000 people (3% of LA County’s population of 10 million) accessed the county’s homeless services at least once.
Viewed through a structural lens, the evidence is compelling that over time the aggregate number of people who enter into homelessness is driven by metropolitan-area level interactions between the cost of housing and income (both wages and safety net support) at the bottom end of the economy. As I summarize here, for many decades LA’s trends have been dismal vis-à-vis both housing and median-and-below wages . However, these structural drivers can only be reversed over the medium- and longer-term. In the near-term, the challenge is to make better use of existing resources.
How, at a time when the regional economy is turning soft, the safety net is under threat, and funds to combat homelessness are set to contract, might available fiscal resources be more effectively deployed? The empirically-anchored analytical framework laid out in this piece might hopefully help address this near-term challenge.
Considered as a flow, homelessness is daunting in its complexity. Multiple drivers lead to homelessness; there are multiple pathways through homelessness; and multiple ways to exit. One way to cut through the complexity is to group the challenges posed by homelessness into three distinct ‘clusters’:
- Short-term homelessness – those who enter and then exit homelessness within 6-12 month (including initiatives to identify and pre-emptively support those most at risk of becoming homeless).
- ‘Slippery slope’ homelessness – those who lack/miss the ‘lifeboat’ of early exit and risk a deepening downward spiral.
- ‘Chronic’ homelessness – those who have lived on the street for long enough and/or have personal vulnerabilities of a kind that render them unable to exit homelessness and live independently without sustained support.
The paragraphs that follow consider each of these, beginning with the last.
Many in LA view homelessness and chronic homelessness as synonymous. As the cluster framework signals, this view is mistaken – though chronic homelessness indeed comprises the most highly visible aspect of homelessness, and its magnitude is large. (As the technical note details, the numbers vary depending on the definition used. According to LAHSA’s highly-granular definition, in 2024 about 32,000 people were chronically homeless. Other estimates range widely – from about 20-42,000 – with the specifics varying according to the definition used.)
Careful micro-level research has shown that “housing first” (more precisely, the provision of permanent supportive housing) is the most effective and cost effective way of helping people who have been chronically homeless to live a stably housed life. Perhaps surprisingly to some, in recent years, LA has had an effective large-scale program of placing homeless people into permanent housing – about 20,000 annually, amounting to over 130,000 since 2017. But permanent housing (especially with the necessary support services) does not come cheap; as of 2025, the LA region was spending well over $300 million annually on its PSH program.
A central reason why implementing “housing first” is so costly is, of course, LA’s massive undersupply of affordable (and other) housing. But this undersupply can only be addressed over the medium and longer-term – a narrow focus on “housing first” thus has little to offer vis-à-vis the urgent immediate challenge of how best to deploy scarce fiscal resources to mitigate the damage to come. Recognizing this brings to the fore the two earlier stages in the homelessness “flow” – short-term and slippery-slope homelessness.
Estimates of the number of people who are homeless only for a short time vary widely. As the technical note details, “stock” estimates derived from the early-2024 PIT count range from 16-26,000, depending on how the cut-off duration is defined. This number is way below the 58,000 that, as per Figure 1, newly accessed homeless services over the course of 2023. [In 2024/25, the number newly accessing homeless services increased to 81,000.] A moment’s reflection will point to the reason for the disconnect – most short-term homeless enter into and then exit from homelessness between counts. As the companion technical note explores in detail, for most people a spell of homelessness is relatively short: about 40% of those who become homeless exit within six months; an additional 30% or so exit over the subsequent eighteen-month period; and a further 20% over the subsequent three years. (Note that at the rates of exit just cited, nine out of ten people who become homeless exit over the subsequent five years – projecting forward this would imply that of the 60,000 people who became homeless in 2023, about 6,000 would remain so in 2028.)
For at least three reasons, these seemingly rapid rates of exit should not be mis-interpreted as implying that homelessness is in large part self-correcting, with policy mattering little for how it evolves. For one thing, the current rapid rates of exit are based on LA’s prevailing ambitious (and fiscally costly) efforts to reduce homelessness. In the coming period, as the presentations to the Leadership Table highlighted, budget cuts will undo a quite substantial part of this effort: entry into homelessness will accelerate; rates of exit will slow. For another, the number of people homeless at any point in time is the accumulated total of those remaining homeless after initially becoming homeless in some prior year. Increases are likely in the number of people who become newly homeless, the numbers will add up rapidly. Perhaps most fundamentally, the challenges of providing support and facilitating exit are not static – what all-too-often happens to those who remain on the streets converts crisis into tragedy. This last brings us to the third ‘cluster – slippery slope homelessness.
As even casual observation of people living on the street reveals, there is a close association between homelessness and personal vulnerability. The background technical note details this association vis-a-vis five sets of vulnerabilities: mental health (MH); substance abuse (SA); physical vulnerabilities, and vulnerabilities associated with prior experience of prior foster care or incarceration. As detailed there, an estimated 57% of an entering homeless cohort have at least one of the five vulnerabilities; 43% have none. (Note that while the impact of economic vulnerability is not analyzed directly, its role is implicit in the relatively large share of ‘none of the above’. )
Figure 2: Mental health and substance abuse among a (representative) 100 person homeless cohort – change over the course of three years.
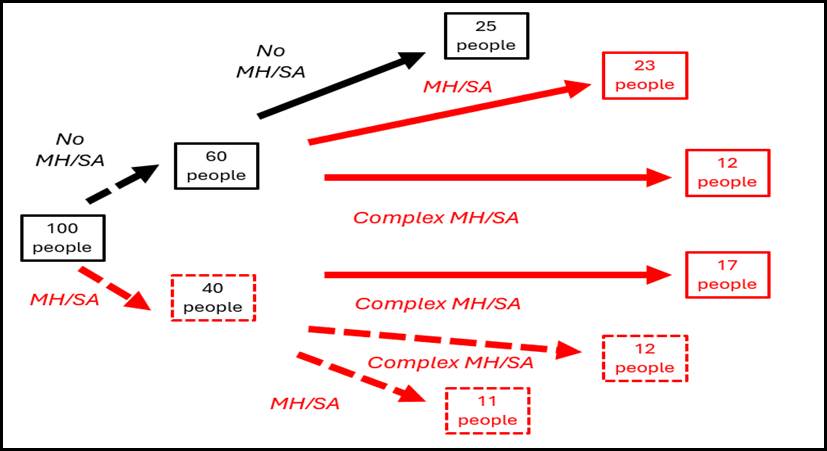
Crucially for policy, as Figure 2 above illustrates, the homelessness-vulnerability association is not static – the incidence of vulnerabilities among the continuing-homeless cohort changes with the passage of time. Why? Because mental health and substance abuse are both causes and consequences of homelessness. Figure 2 provides specific estimates of the magnitudes by which MH/SA challenges compound as a result of homelessness. (See the background note for details on how these “flow” parameters were estimated.) Forty of a representative cohort of 100 homeless people had struggled with MH/SA issues prior to becoming homeless; for 17 of the 40, symptoms become more complex over the course of three homeless years. Even starker are the trends among the 60 people who entered homelessness with no MH/SA challenges: After three years of homelessness, 35 of the 60 have MH/SA symptoms, including 12 who wrestle with complex MH/SA challenges.
Stepping back from the details, how might the three-cluster framework help address some urgent, looming policy challenges confronting LA’s efforts to address homelessness? At its recent meeting, the Leadership Table was put on notice that in the coming year, spending to address homelessness would need to be cut by about one-third (!!), even as the number of people becoming newly homeless would continue to rise. An obvious first step is to look for efficiency gains – how well are resources being used to deliver on programs already underway? But belt-tightening can only go so far. When the required cuts are large, attention also needs to be given to effectiveness – are we doing the right things? The three-cluster framework potentially offers some insights vis-à-vis the latter question.
Viewed as a “stock” the policy challenge is seemingly the relatively straightforward one of reducing numbers, with each person newly-housed (via, say, “housing first”) moving things closer to the goal, with priority for the chronically homeless. By contrast, viewing homelessness as a flow directs attention to the ‘short-term’ and ‘slippery-slope’ clusters – and thus to the value of intervening as early as possible in a person’s homelessness journey – the earlier the exit from homelessness, the lower are its personal, fiscal and social costs.
Considering priorities through this latter lens, a variety of questions arise: Are there cost effective ways of forestalling homelessness for those who are at greatest risk? What facilitates rapid exit from homelessness? For those for whom homelessness has begun to take hold, what can be done to reduce the risk of journeying all the way down the slippery slide to disaster?
None of the above questions are new to those who have long labored to reduce homelessness. Even so, at this moment of fiscal stringency when it is urgent to look again at how resources are being used, perhaps the empirical lens laid out in this note contributes in a small way to taking a more expansive view of the options available – one that not only focuses on how to minimize damage to ongoing programs but also assesses comparatively the cost effectiveness of a broad range of possibilities for addressing our region’s homelessness crisis.