Economic inequality and political polarization fuel one another. Recent, co-authored work explored how the collision between strong institutions, massive inequality and toxic institutions is playing out in South Africa. What relevance might the South Africa experience have for the USA’s current struggle with toxic polarization?
[As part of an ongoing research project on the above question, I’ve immersed myself in recent literature and data as to trends and drivers of US inequality. Though I’d thought myself to be quite well-informed, I found the USA’s economic transformation to be way more far-reaching (with potentially more dire consequences) than I had realized. Perhaps this summary overview will be of interest. Regardless, at this quite early stage of the comparative research, feedback on the way I have summarized and interpreted the evidence on US inequality will be especially useful.]
Driven by a combination of globalization, technological changes, policy choices and changes in norms and institutions, the United States economy has undergone far-reaching structural changes and distributional shifts. Figure 1 (from Branko Milanovic, using the LIS data set) provides an overview of the distributional shifts, using the Gini coefficient as the summary measure of inequality (higher being more unequal); it distinguishes between gross inequality (income before taxes and transfers) and net inequality (disposable per capita income). As the figure shows, US inequality has been on the rise since the end of the 1970s.
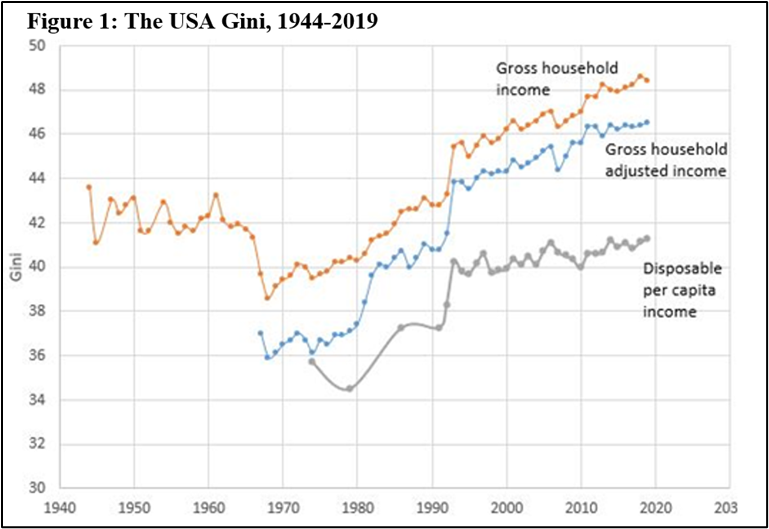
Figure 2 and Tables 1 and 2 give a more granular perspective of the transformation of the US economy from an inclusive-growth engine into an inequality-generating doomsday machine. The machine has three speeds: accelerating income growth at the top end of the distribution; good-enough dynamism for an upper-middle class educated elite, enabling it to more-or-less hold its own; stagnation or decline for almost everyone else.
As Figure 2 signals, between 1946 and 1980 pre-tax real income grew at an annual average of about 2% across all segments of the distribution, other than the very top where income growth was slower. However, subsequent to 1980, growth became concentrated in the top 1 percent of the distribution and, within that, in the top 0.01 percent of the distribution. As per Emmanuel Saez and Gabriel Zucman (who constructed the figure), between 1980 and 2018, “for the bottom 50 percent as a whole, growth in pre-tax income [between 1980 and 2018] has been only 0.2 percent per year. Excluding the elderly (aged 65 or more), average bottom 50 percent pre-tax income has declined slightly since 1980.”
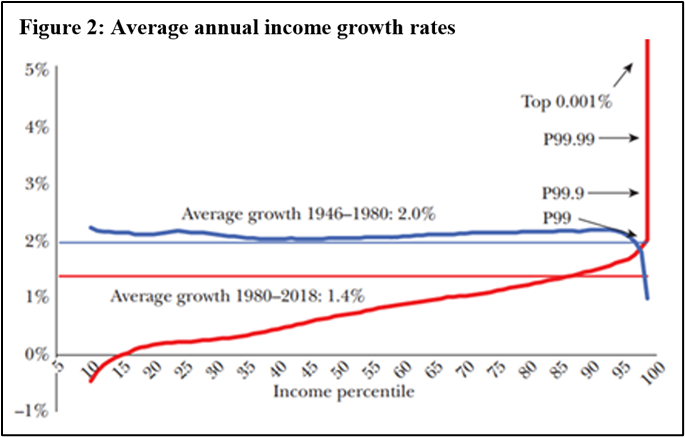
Table 1 compares the distribution of pre-tax income in 1979 and 2019 (data are from the World Inequality Database). Between 1979 and 2019, the US economy almost trebled in size. Over that time, the share of (pre-tax) income accruing to the top 10 percent rose from 34.7 to 45.5 percent (with 8 of the 11 point gain going to the top 1 percent). As the right-hand column of the table signals, 51.5%of the total increment in real income over the 40-year period went to the most affluent 10 percent; less than 10 percent of the gains accrued to the bottom half of the population.

Disaggregating further, Table 2 draws on data from the Congressional Research Service to summarize changes in earnings between 1979 and 2019 for the representative (median) employee, across a variety of employment categories,. Over the 40-year-period, median earnings for employees with an advanced degree increased by 27 percent; for all women, median earnings increased by 28.9%. Men and workers without an advanced degree did not fare well: the median hourly wage for men was stagnant; earnings for the median employee with less than a Bachelor’s degree declined. Combining two sub-groups (the combination is one with particular salience for political economy analysis of America’s current travails…..), between 1979 and 2014, the real earnings of the median white male employee in the 25-54 age range with less than a college degree fell by 23.4 percent.

What accounts for the far-reaching distributional changes between 1979 and 2019? The data in Figure 2 and Table 1 are for pre-tax income, so the explanation cannot be found in policy-driven changes in taxes and transfers. Nor do accelerating globalization and far-reaching technological change provide an adequate explanation: Europe also was affected by changes in technology and trade; however, as shown in Figure 3 (published by The Economist, using WID data), its (pre-tax) distributional changes were far more modest.

An emerging consensus emphasizes the role of ‘pre-distributional’ policies, norms and institutions in accounting for much of the US-Europe distributional divergence. Here is how Lucas Chancel (at the Paris School of Economics and co-director of the World Inequality Database ) made the case in a chapter in Olivier Blanchard and Dani Rodrik’s recent co-edited book, Combating Inequality:
“To understand the US-EU inequality gap one must look at policies impacting pretax income growth….(specifically) inequality differences in access to higher education and training…. differences in the organization of health systems…. in labor market institutions (including minimum wage rules, the power of trade unions and collective bargaining agreements to set wages at the sectoral level)…and the distribution of power in corporate governance bodies.”
Back in 2007, Paul Krugman provided an early, quote-worthy interpretation of the US experience along related lines:
“Surely deindustrialization must explain the decline of unions….Except that it doesn’t. Most of the decline in union membership comes from a collapse of unionization within manufacturing, from 39 percent of workers in 1973 to 13 percent in 2005…..Business interests, which seemed to have reached an accommodation with the labor movement in the 1960s, went on the offensive against unions beginning in the 1970s….hardball tactics….at least one in every twenty workers who voted for a union was illegally fired….” (p. 150)
“CEOs have seen their income rise from about thirty times that of the average worker in 1970 to more than three hundred times as much [in 2005]…… [This change] is largely due to changes in institutions, and in norms such as the once powerful but now weak belief that having the boss make vastly more than the workers is bad for morale…. The existence of powerful unions acted as a restraint on the incomes of both management and stockholders.….. Unions that might once have walked out to protest against executive bonuses had been crushed by years of union-busting” (p. 145).
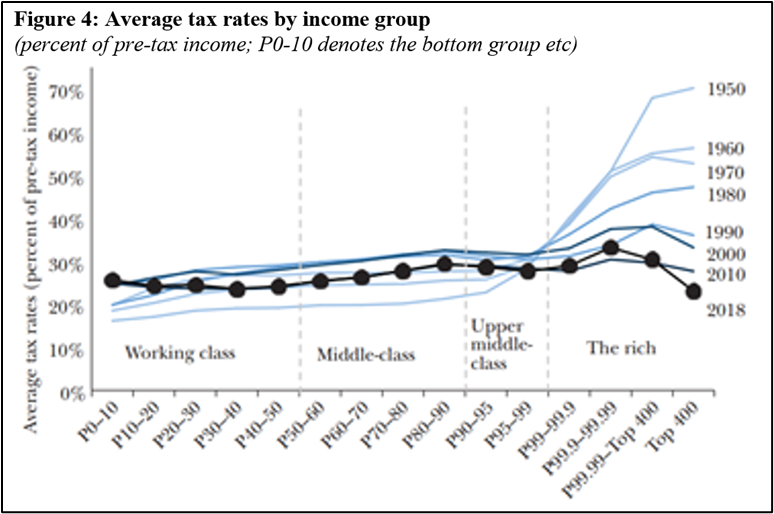
Finally, we come to the impact on inequality of fiscal policy. Figure 4 reports on trends in taxation across the earnings distribution, disaggregating within the top 1%; it uses a comprehensive data set that incorporates federal, state and local tax. Here is how Saez and Zucman (who constructed the figure) describe the resulting pattern:
“The US tax system used to be slightly progressive for the bottom 99 percent of the income distribution, but highly progressive within the top 1 percent….In 1950, for example, the top 10 percent, excluding the top 1 percent, paid average taxes rates of around 25 percent, while the top 0.01 percent paid almost 70 percent of its income in taxes. In 2018, the US tax system looks like a giant flat tax that becomes regressive at the very top end”.
The path from the tax progressivity of the 1950s to the current regime has been circuitous and somewhat opaque. Data on trends in average effective Federal tax rates since 1979 show that the top rate shifted with the political winds. Back in 1979, the average effective Federal tax rate paid by the top 1 percent on income of all types (ie the percentage of total taxable income of the top 1% actually paid in Federal taxes) was 35 percent. By 1986, after the Reagan tax cuts, it had fallen to 25 percent. In the mid-1990s, the Clinton years, it was back up to 35 percent. It fell again (to 28 percent) during the George W. Bush presidency. It was back up to 33 percent under Obama – and then down again, in the Trump years, to 25.4 percent.
The rates of taxation on corporate profits also influence distributional outcomes. The Federal corporate tax rate declined from 45 percent in the late 1970s, to 35 percent from the latter 1980s until 2017, and then to 21 percent in the Trump years. Decisions as to whether and how to incorporate untaxed and undistributed corporate profits affects estimates of the extent of overall tax progressivity. Saez and Zucman assign these profits to the underlying shareholders. Having done so, they conclude that the system becomes increasingly regressive, “because of the demise of the federal corporate tax, which in 2018 collected only 1.5 percent of national income, down from 5-7 percent in the 1950s”.
On the expenditure side, as Figure 1 illustrated, redistributive fiscal policy can help reduce the Gini coefficient,. Back in 2007, Krugman estimated that:
“The United States spends less than 3% of GDP on programs that reduce inequality among those under 65. To match what Canada does we would have to spend additional 2.5%; to match what most of Europe does would require an extra 4% of GDP; to match the Scandinavian countries, and additional 9%.”
Health care reforms aside, as of this writing the USA commitment to a stronger set of inequality-reducing programs has not changed for the better.
In sum, for about three decades after the Second World War, the American economy seemed to be a well-oiled machine that, notwithstanding many political ups-and-downs, continually produced broad-based growth. Then things changed. While real GDP nearly trebled between 1979 and 2019, more than half of the gains went to the top 10 percent; their pre-tax real income almost quadrupled, and their effective real tax rates declined. About one in five dollars of their gains was paid in taxes. Meanwhile, for broad swathes of the labor force (males especially), real hourly earnings declined. Even without (yet) delving into the specific political economy causal mechanisms, that economic polarization of this magnitude has been accompanied by accelerating political polarization should come as no surprise.

Pingback: Now what? – Strategic and unstrategic ways forward « WORKING WITH THE GRAIN: Integrating governance and growth